I am irresistibly drawn to Venn diagrams. They make me very happy.
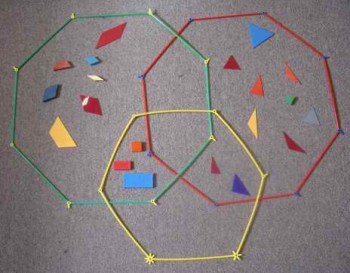
I love how accessible they are to emerging mathematicians. We can draw a Venn diagram on the ground and use it to sort objects — even ourselves! — into categories. An animal-sorting example: those that live on land (green hoop), those that live in the water (blue hoop), those that live in both (in the intersection of green and blue), and those that live in neither (outside of both green and blue). Or a shape-sorting example: the green ‘hoop’ contains quadrilaterals, the red ‘hoop’ contains triangles, and the yellow ‘hoop’ contains shapes with right angles.
Counting the number of regions in a Venn diagram with n sets is a neat argument. Suppose we have a Venn diagram with three sets labelled A, B, C. Then any region is: inside or outside of set A, inside or outside of set B, inside or outside of set C. There are two possibilities for each of three sets, so there are 2×2×2 = 23 = 8 possible regions. We can generalise this argument to n sets.
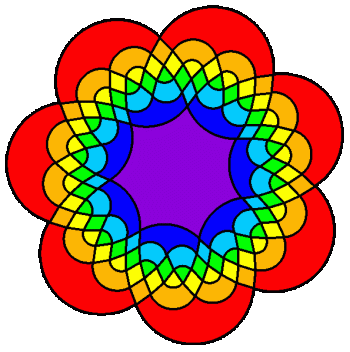
Venn diagrams also fascinate experienced mathematicians. See, for example, the survey by Frank Ruskey and Mark Weston in the Electronic Journal of Combinatorics. I am particularly taken with this symmetric Venn diagram1 for seven sets, and not only because it is named after my home city of Adelaide.
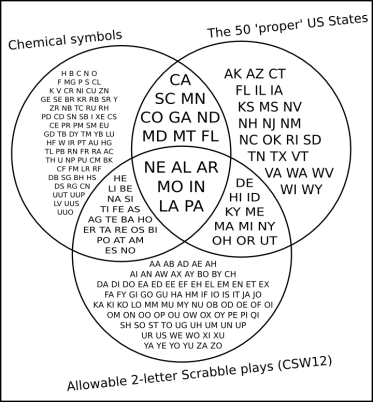
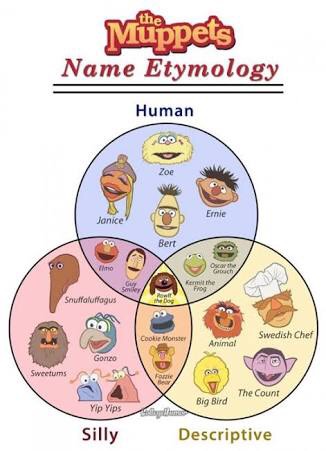
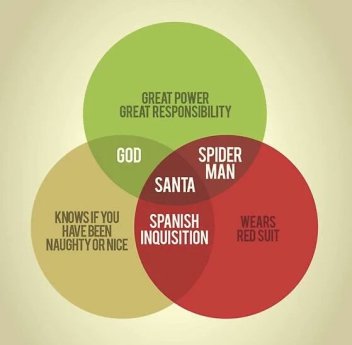
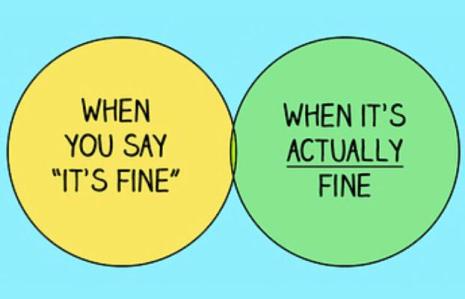
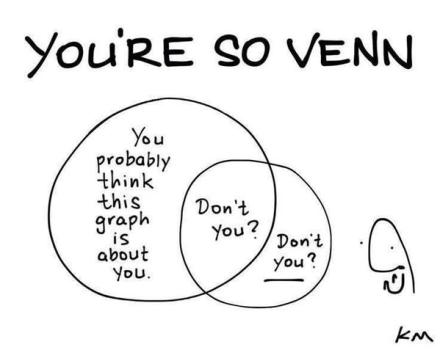
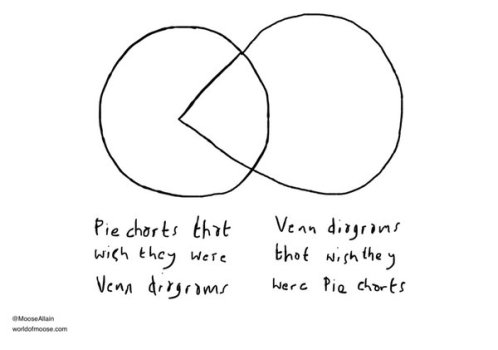
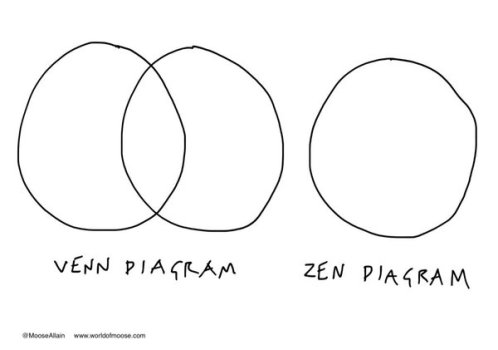
Venn diagrams can be clever, comedic or both. Below I share some of my favourites. I’ve tried to attribute authors, where known. If you can fill in the gaps, please let me know. And, do share your favorites with me! (Update: while looking for authors, I found this tumblr account, Fuck Yeah Venn Diagrams, and this twitter account: @venn_diagrams. Ohhhh yeah.)


[1] Image source: www.maths.tcd.ie/EMIS/journals/EJC/Surveys/ds5/gifs
