
This is the fifth in a series of posts about my course ‘Developing Mathematical Thinking’, a maths content elective for pre-service teachers training in primary and middle maths. All posts in the series are here.
In my last two posts I’ve been explaining how I’ve introduced the ‘Notice and Wonder’ routine to my pre-service teachers. We started with the value of ‘Notice and Wonder’ for sense making. We then looked at photos from the world around us and brainstormed what we noticed and wondered. My intention was that students would gain experience with everyday situations before transferring their ‘Notice and Wonder’ skills to mathematical settings. In this post I’ll write about the next stage of this journey. But to do this, I want to first tell you about a great task and how I’ve never managed to do it full justice.
An activity that fizzled — because of me
Imagine a long thin strip of paper stretched out in front of you, left to right. Imagine taking the ends in your hands and placing the right hand end on top of the left. Now press the strip flat so that it is folded in half and has a crease. Repeat the whole operation on the new strip two more times. How many creases are there? How many creases will there be if the operation is repeated 10 times in total?
I originally saw this problem in Thinking Mathematically (Mason, Burton, Stacey). Looks like a great problem, right? Try it for yourself, either visually or physically. You might notice relationships between the number of folds, the number of creases, the number of sections, and more.
Paper Strips is an activity rich in opportunities to make conjectures and test them out. For the past two years I’ve positioned it in Week 7 of a 12 week program, when we are deep in conjecturing, justifying and proving. In this context, I’ve given students the description above, a few strips of paper, and asked them to record the number of sections and creases for a given number of folds, to make conjectures, and to try and justify their conjectures.
And it has bombed. Both times. A charitable student in either of those classes would say that it was ‘fine’ — hardly a ringing endorsement. This year I was planning on dropping the problem. I could see how rich it was mathematically, but I just couldn’t see how to make it shine.
And then it dawned on me.
It’s all in the presentation
I’ve mentioned before that I was fortunate to attend a micro-conference in June led by Anthony Harradine. This was a master-class in having people think and work mathematically. Anthony emphasised three key ingredients for a successful problem-solving experience for students.
- Pick a problem where students are likely to already have the required ideas and skills. My interpretation is that the problem-solving process is already cognitively demanding and so students shouldn’t also be grappling with calculations that they find difficult.
- How the problem is presented matters a great deal. Let students have ideas about the problem. (And, if needed, find a way to make them have the ideas that you need them to have!) Acknowledge and value all their ideas. If their ideas don’t suit your purpose, put them on an imaginary shelf to be pulled down and tackled later. (This is similar to Dan Meyer acknowledging all questions that students have in the initial stages of a Three Act task, and returning to them at the end to see if they can now be answered.)
- The way that students work on the problem is important. How much structure will you provide? Will students work individually or collaboratively? How will students share their resolutions? Will you provide a full resolution? What will you leave them to think about?
Back to Paper Strips. While planning Week 3 — and looking for a more mathematical setting for students to develop their ‘notice and wondering’ skills — it occurred to me that in the past, I’d had two out of these three elements for Paper Strips. But I was missing a vital ingredient: the right presentation that let students have more ideas for themselves.
The revival: notice and wonder to the rescue
This year I told students that we were going to do a visualisation activity, and that I would walk them through a set of instructions.
- Imagine a long thin strip of paper stretched out on the table in front of you.
- Hold each end.
- Now fold the paper by moving your left hand over to your right.
- Make a crease along the folded edge with your left hand.
- Now hold the creased end with your left hand.
- Fold it again by moving your left hand towards your right.
- Make another crease.
- Now slowly imagine the paper unfolding.
- What does it look like?
This presentation is exactly as outlined in the Shell Centre’s Problems with Patterns and Numbers, of which John Mason is a co-author. And compare it to the earlier description. Similar, right? But not the same.
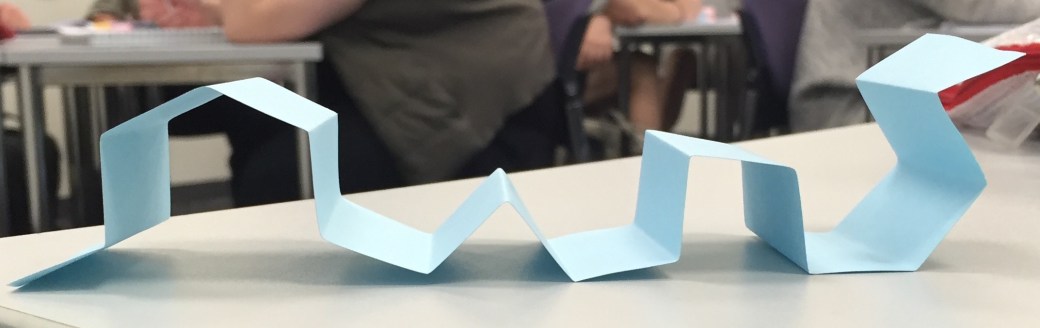
Rather than continue on and ask students to investigate the number of creases and folds, I lingered on ‘What does it look like?’ I asked students to draw what they thought it looked like. Sketches ranged from the simple to the complicated. A typical sketch looked like this, although a few others were 3D.

I then handed out strips of paper and repeated the instructions. They compared their record of their mental image with the physical model. I asked them if there was anything else that they noticed about their physical model that was missing in their drawing.
Students then brainstormed other features they noticed about their strip of paper. As a group we noticed creases, folds, sections, sections of equal size, up creases and down creases, the pattern of the creases (two folds gives down, up, up), the dimensions of the strip of paper. We agreed on definitions for many of these terms. We thought about whether our diagrams could be more accurate. For example, were our sections of equal size? Have we distinguished in our diagram between up and down creases? Is accuracy even important here?
Next I suggested that students make more folds, and brainstorm anything new that they noticed. I also asked them to record what they wondered. How did the paper-folding process affect the features of the paper strip that we identified earlier?
The very first idea volunteered is shown below. Look at the profile that forms when the sections between two ‘up creases’ (∨ shape) are placed flat. How does this pattern change with more folds?
Other students added on to this idea. They noticed what would happen to the profile when we unfolded the paper. What do you think will happen?

Another group had wondered how the original dimensions of the paper strip affected the size of sections after each fold. They noticed that sometimes it resulted in a square, and sometimes in rectangles of particular sizes.
These were the first three observations in one group and I loved them. I hadn’t even noticed them as I’d only been considering the strip as a 2D object. Other ‘notice and wonderings’:
- Is there a formula for the number of creases for a particular number of folds?
- The number of sections seems to double with the number of folds.
- The number of sections seems to be one more than the number of creases.
- It looks like there is always one more down crease than up crease.
- The more folds you do, the shorter the ‘bottom layer’ and so that affects things. (The physical process differs from the theoretical process.)
- There seems to be a pattern between the number of consecutive down folds (∧) and the number of folds.
- Is it possible that the maximum number of down folds in a row is three?
- The number of creases appears to be one less the number of folds.
- Could we predict the crease pattern after another fold?
- …
Many of the ideas I wanted them to notice came out of the brainstorming exercise — and so many more interesting questions that I hadn’t even considered. Fifty brains are definitely better than one!
This was the endpoint for this activity. Notice how we didn’t resolve any of these questions as a group. Some students worked out formulae or explanations, but I asked them to keep those private for now. There will be time later when we dig into justifications to revisit this problem.
And now for the whole truth
When I started writing this post, I had thought that ‘Notice and Wonder’ was the key to making this activity shine. It’s the truth, but it’s not the whole truth. Looking back through last year’s photos, I had written a big ‘Notice and Wonder’ next to my instructions for students on the whiteboard. And yet it still kind of flopped.
As The Classroom Chefs say, how you plate a meal is important. And as with meals, how a maths problem is presented is everything! Jennifer Wilson’s latest blog post also reminds me that, throughout their book, John and Matt constantly encourage us to savour our meals, that is, to slow down.
Go back through the Entrée stories you just read, and look specifically at the questions each teacher asked the students. Notice how no teacher was in a hurry; they let students discuss a topic or an idea until they were satisfied that the students fully understood it.
Slow maths. Let students notice and wonder for themselves. Don’t rush them towards what you want them to focus on. As Anthony Harradine said: ‘Let students have ideas about the problem. And, if needed, find a way to make them have the ideas that you need them to have.’. For Paper Strips it was the right presentation, combined with slowing down, that meant I didn’t need to find a way for students to notice what I wanted them to see. They saw that — and so much more.
